Let's talk business

Funnel
Analysis
Project Overview
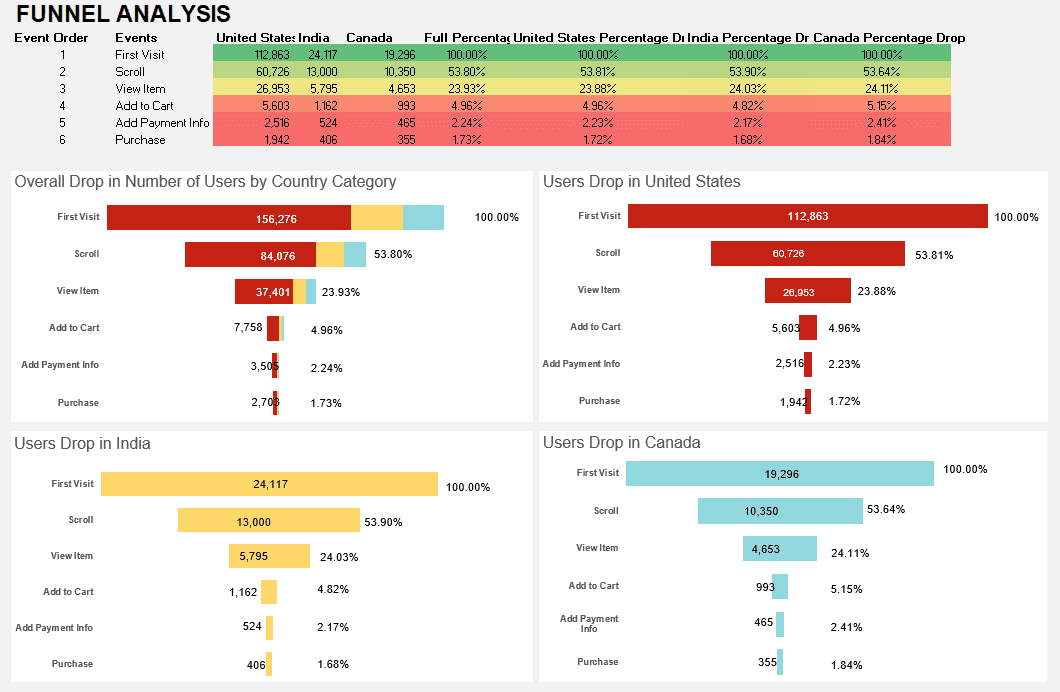
The Funnel Analysis project is an in-depth examination of customer journey stages, showcasing my expertise in SQL and Excel to track and analyze conversion rates. This analysis reveals where potential drop-offs occur, helping to optimize each stage for better conversion. The project covers each funnel stage in detail, highlighting critical metrics and insights into customer engagement.
Key Sections
SQL Analysis
Using SQL, I extracted and segmented data to analyze each stage of the funnel, focusing on key metrics like the number of users entering and exiting each stage, conversion percentages, and time-to-conversion. I applied SQL functions for aggregations, joins, and conditional statements to ensure accuracy in each stage's data representation.Excel Analysis
I utilized Excel for data visualization and detailed analysis, creating charts to illustrate the conversion flow across stages. I also performed calculations to identify average conversion rates and pinpoint significant drop-off points, providing insights into potential areas for optimization.
Goals
Track and analyze each stage of the customer journey funnel.
Identify the stages with the highest drop-off rates to inform optimization efforts.
Calculate and visualize conversion rates to understand customer engagement.
Provide actionable recommendations to improve customer retention and conversion.
Demonstrate data analysis proficiency using both SQL and Excel.
Interested
or have
questions?
Summary
Funnel Analysis - A data-driven journey, showcasing expertise in SQL and Excel, the fusion of analytics and aesthetics in this visually captivating dashboard.
Tools
SQL, Excel
Method
Exploratory Data Analysis (EDA), Dashboard Design, Data Cleaning, Data Visualization
Functions
Aggregations, Windows Functions, CASE, GROUP BY, DATE_DIFF; Charts, Conditional Formatting, Pivot Tables, Slicers